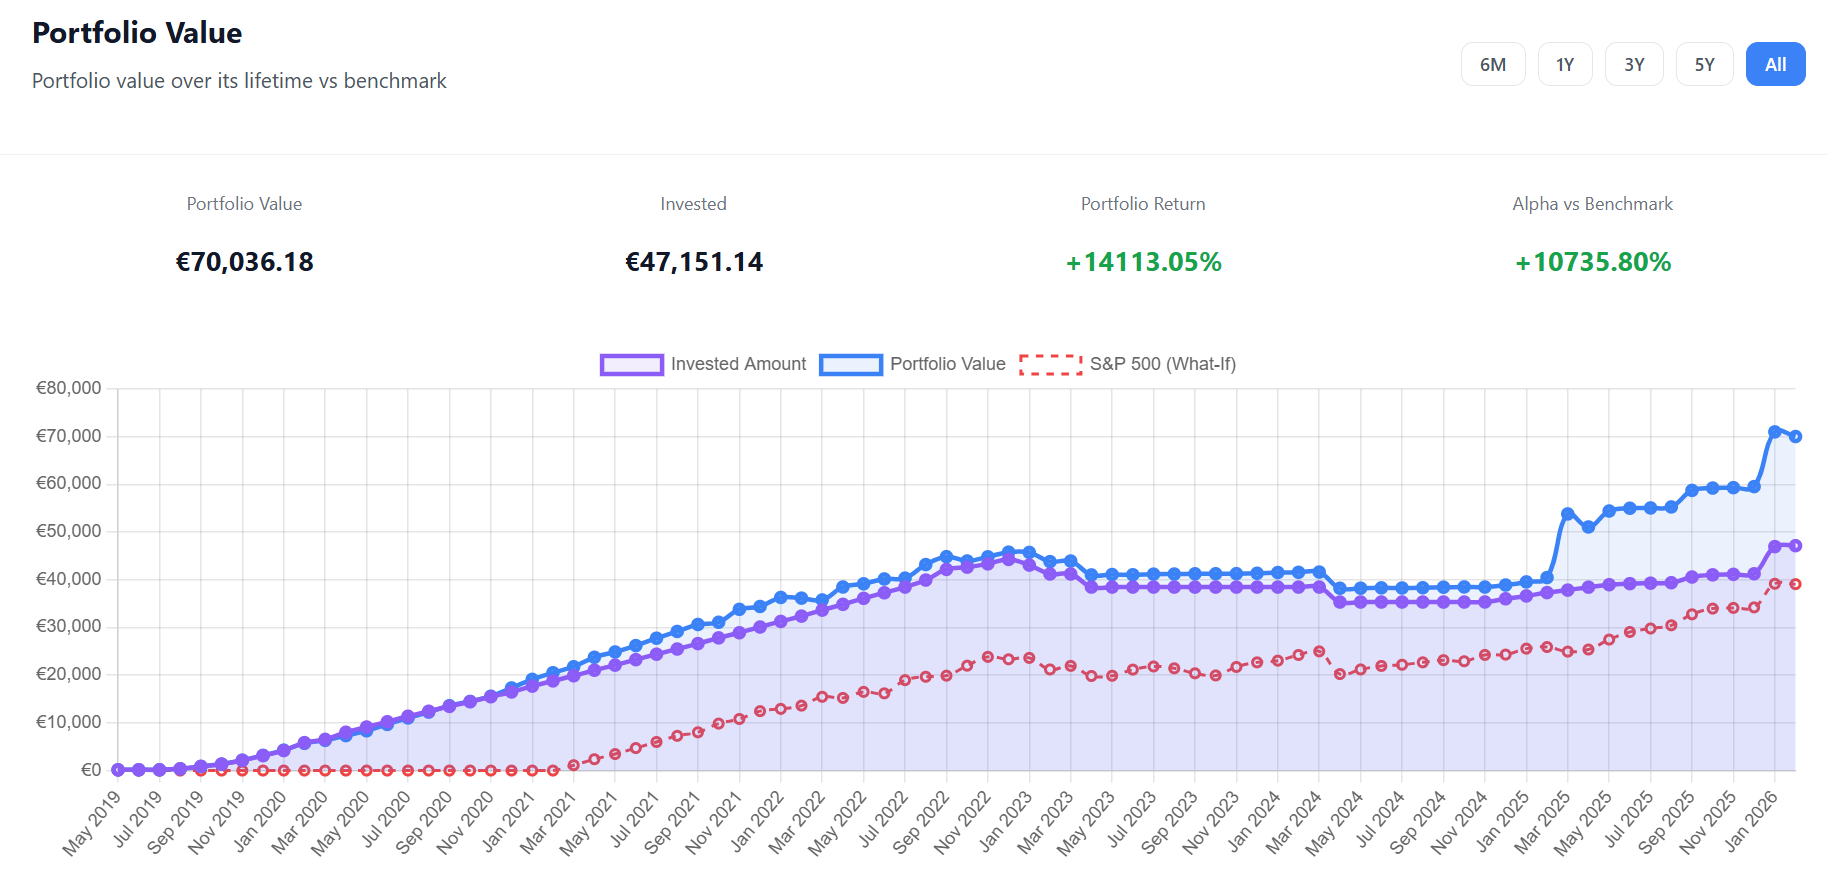
The Portfolio Value vs Benchmark chart is the centrepiece of the Growth page. It plots three lines on a single chart so you can instantly see whether your investment decisions are beating the market.
The Three Lines
- Invested Amount (purple) — the total cash you’ve put into your portfolio over time
- Portfolio Value (blue) — what your holdings are actually worth today
- Benchmark What-If (dashed red) — what your portfolio would be worth if you’d bought the benchmark instead
How the “What-If” Calculation Works
Every time you made a transaction, we simulate what would have happened if that same money had gone into the selected benchmark (e.g., the S&P 500).
For a buy transaction of €1,000 on 15 March 2025:
- We look up the S&P 500 closing price in EUR on that date
- We calculate how many “benchmark shares” €1,000 would have bought
- Those shares accumulate over time
For a sell, we proportionally reduce the simulated benchmark shares. At every month-end, we multiply your accumulated benchmark shares by the current benchmark price. That gives you the dashed red line.
What to Look For
- Blue line above the red dashed line — you’re outperforming the benchmark. Your stock picks are beating the market.
- Red dashed line above the blue — the benchmark is doing better. You might consider shifting more into index funds.
- The gap between the lines is your alpha — shown as a percentage in the summary cards above the chart.
Time Range Filters
Use the buttons above the chart to adjust the view:
| Filter | Free | Premium |
|---|---|---|
| 6M / 1Y | ✓ | ✓ |
| 3Y / 5Y / All | — | ✓ |
Choosing a Benchmark
Free users compare against the S&P 500. Premium users can choose from 30+ benchmarks including EURO STOXX 50, NASDAQ-100, MSCI World, DAX, FTSE 100, Bitcoin, and popular ETFs like VOO, QQQ, and VWRL.
Tips
- If your portfolio consists in basically European companies, try comparing against the EURO STOXX 50 instead of the S&P 500 for a fairer comparison.
- The “All” time range gives you the full picture from your very first transaction.
- Benchmark data is updated daily after US market close (22:00 UTC).
Comments 0
No comments yet. Be the first to comment!
Leave a comment