The Portfolio Performance section on the Growth page gives you six key metrics at a glance. Here’s what each one means and why it matters.
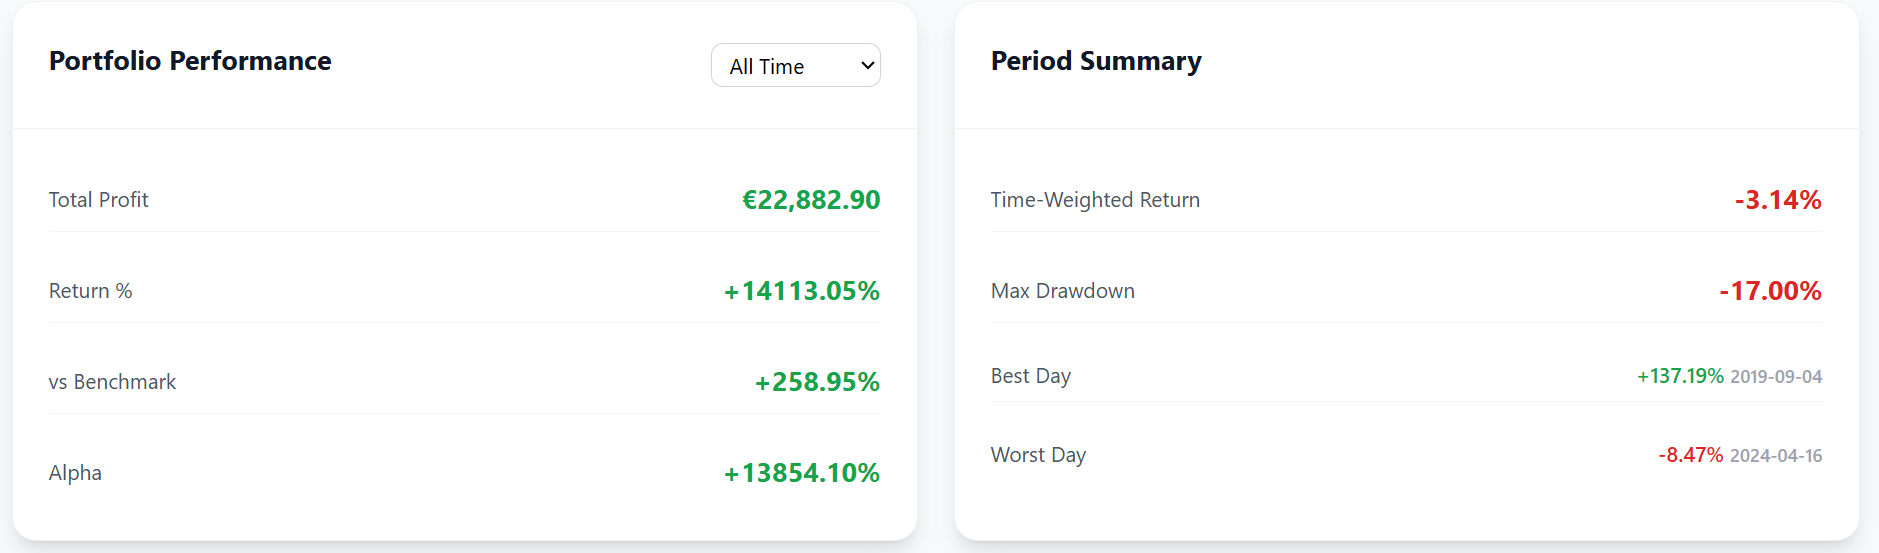
Total Profit
The absolute euro amount your portfolio has gained or lost over the selected period. This accounts for both price changes and any new money you’ve added or withdrawn.
Return %
Your simple return percentage: how much your portfolio has grown relative to its starting value, adjusted for cash flows. A +25% return means every €100 at the start of the period is now worth €125.
Time-Weighted Return (TWR)
TWR is the gold standard for measuring investment performance. Unlike simple return, it removes the effect of cash inflows and outflows. This means your return isn’t inflated by adding a large sum right before a market rally, or depressed by withdrawing before a dip.
TWR breaks your investment timeline into sub-periods between each transaction, calculates the return for each sub-period, and compounds them together.
Max Drawdown
The largest peak-to-trough decline in your portfolio’s value during the period. If your portfolio hit €50,000 and then dropped to €45,000 before recovering, your max drawdown is -10%. This tells you the worst pain you experienced — useful for understanding your risk tolerance.
Best Day / Worst Day
The single day with the highest and lowest return percentage. These highlight your most volatile moments and can help you understand how market events affected your portfolio.
Alpha
When you select a benchmark, alpha shows the difference between your portfolio’s return and the benchmark’s return. Positive alpha means you’re beating the market. Negative alpha means the index did better.
Period Filters
| Filter | Free | Premium |
|---|---|---|
| 1M / 3M / 6M / YTD | ✓ | ✓ |
| 1Y / 3Y / 5Y / All | — | ✓ |
Comments 0
No comments yet. Be the first to comment!
Leave a comment